Capacity planning – A DBA primer
Capacity planning is essential to deliver a pre- determined optimal/consistent user experience throughout the lifecycle of a solution.
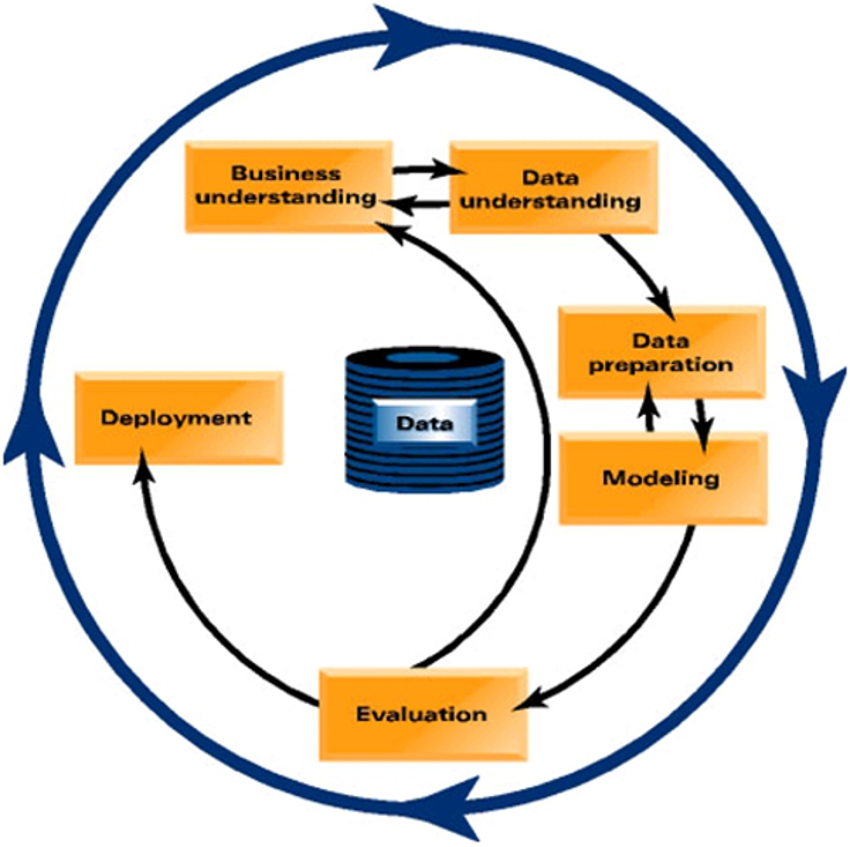
Our capacity planners, using your business plans, needs, and forecasts, would calculatingly determine what the future needs will be to guarantee scalability, availability, and stability. Our analytical modeling tools would help the planners get answers to “What if” scenarios so that a range of possibilities can be explored. The capacity planners are especially receptive to products that are seen to be scalable and also stable and predictable in terms of support and upgrades over the life of the product. As new technologies emerge and business strategies and forecasts change, capacity planners must revisit their plans.
Collecting stats & Profiling
The first step is to identify suitable stats and capture them (assuming the application is in steady state).
Statistics are from the application as well as the from the infrastructure (CPU/Memory/Storage etc).
Then, one needs to start with profiling the application.
Profiling the environment will help in
- Understanding the needs of the environment
- Correlating statistics from the application with the infrastructure.
- Charting and predicting growth using the previously established thresholds and
- As a result – proper capacity planning to meet the growth
- Profiling can in-turn help identify performance issues and bottlenecks as an additional benefit during the process of capturing statistics.
Once profiling is done, the next step is to establish thresholds
Thresholds
Thresholds indicate your comfort level for e.g. Redo/Day cannot exceed 50GB/day beyond which I need to revisit my redo
configuration. Thresholds need to be defined and set for the key statistics in the profile. Also, you identify the course of action to be followed if a threshold is violated. Reviewing the key statistics in the profile on a daily/weekly basis will allow you to plan in advance as to what changes need to be done
Oracle perspective
How can I do capacity planning on a pro-active basis for my Oracle instance?
Oracle Capacity planning
The answer to this lies in reviewing, collating and corroborating Oracle statistics with statistics from various other subsystems such as OS, Storage, and Network over a period of time.
- The key is to know which statistics to look at, how to interpret the numbers and establish thresholds.
- It is essential to know when to drill down into session level stats and when to stick to the top level as otherwise, the stats will become overwhelming.
- Not to forget, Capacity planning is proactive whereas performance tuning is mostly reactive
Oracle Stats and Wait events
From an Oracle perspective, both stats, as well as wait events, need to be captured on an ongoing basis.
- One would capture stats at an instance level and if required at a session level.
- To begin with, one can start with instance level stats collected every 24 hrs. The finer the interval, the more accurate the results, however, it can get very cumbersome.
- It is best not to use the dba_hist views/AWR, but rather collect the stats from the v$views.
- The v$views are mostly incremental views and contain data from the instance startup time
- Stats can be collected for
- Work Load
- User related (Transactions,
logons , parses etc) - Redo activity
- Undo activity
- Temp activity
- Tablespace and object space usage
- PGA usage
- SGA usage
- Parallel Operations
- IO Operations
- File Stats and Temp Stats
- Wait events help mostly in performance tuning and identifying steady state behavior.
- For wait events, Top 10 waits including CPU time ordered by Time Waited along with
- Average Wait time
- Total Waits
- Wait class
Filter out idle and parallel (PX*) waits
Infrastructure Statistics
From an Infrastructure perspective, to begin
- CPU– Utilization, run queue, context switches (voluntary and involuntary), interrupts, system calls, thread migrations)
- Storage– Number of IOPS/second, Queue Depth, Size of IOPS, Response time (
lun level,volume and file), throughput. - Filesystem– Usage, response time and growth.
- Memory– Physical memory consumed, swap in/out, page faults
- Network– Throughput and details from netstat–s and
kstat .
It is important to note that OS stats are generally not event driven and are time sampled. So they need to be correlated with application stats to make sense.
Basic Oracle Instance profile
These stats allow us to create a simple and basic profile of the instance which can be used for daily reporting (shown next slide).
It is important to note that even though many magnitudes of statistics are collected
To summarize
- Profile the environment
- Collect and collate
initial set of statistics whenenvironment is steady state and user response time is deemed satisfactory– Oracle, OS, Storage,Network . - Define and establish thresholds– Oracle, OS,
Storage and Network. As before, user response time should be deemed satisfactory. - Repeat statistics collection over a defined period of time– Maybe monthly or quarterly.
- Establish a pattern of change– certain statistics increase over a period of time, whereas others decrease.
- Based on the pattern of change, plan on adding additional capacity.
- At any point during this time, bottlenecks can be identified and resolved accordingly.